
 About two weeks ago, a lawyer friend of mine asked me to look at the statistics submitted in the April 26-27, 2013 minutes of the ABA’s Section of Legal Education and Admissions to the Bar Standards Review Committee (“Standards Committee”). The worn out joke about lawyers is that they went to law school because they hate or couldn’t do statistics. But I am a lawyer, I like statistics and a significant part of my doctoral training was in statistical models. When I reviewed the Standards Committee presentation of the data, I became dazed and confused.
The statistics were offered in support of the Standards Committee proposed to change the bar passage requirement for the accreditation of law schools. Under Proposed Standard 316, 80% of a law school’s graduates must pass the bar within 2 years (5 tries) (this is called the “look-back period”). Under the current rule, there’s a 75 % pass rate that must be achieved within 5 years (10 attempts) of graduation. This change has stirred controversy because of its potential impact on non-traditional students, particularly students of color.
The proposed changes are based on a study of past examinees, and it’s important to review them before you make up your mind.
In support of the proposed changes, the Standards Committee musters up a slender thread of evidence—that the overall bar pass rate for the past five bar exams have ranged between 79% and 85%. Opponents have jumped all over this morsel of evidence. Readers can see these objections expressed in a letter to the Standards Committee from the Chair of the ABA Council for Racial and Ethnic Diversity in the Educational Pipeline
This posting takes a closer look at the data to support the ABA proposal for the shortening of the look-back period from the existing five years (10 tries) to two years (5 tries).
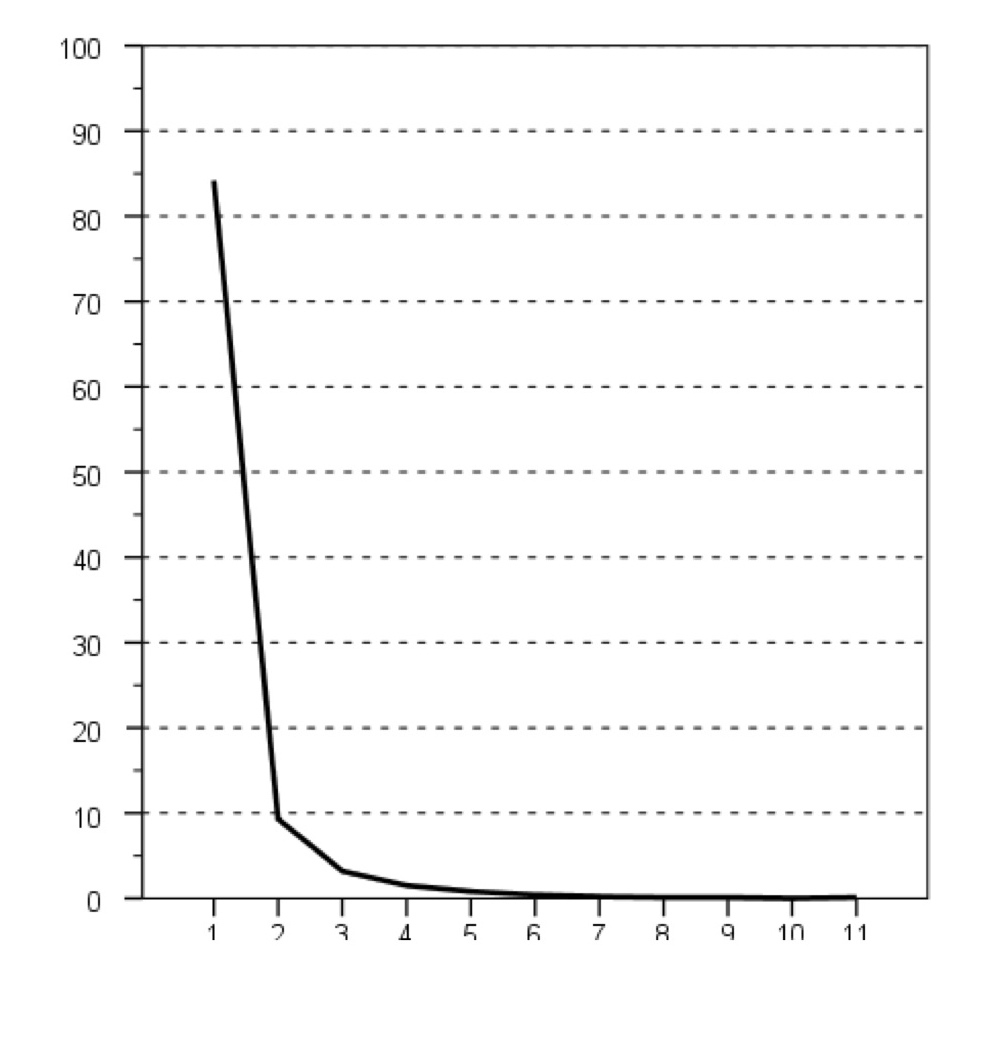
The Figure 1 (shown below) was used to support the Standards Committee’s proposal, and it warrants a careful look because it is very similar to the other graphs the Committee used to support its proposal. The figure shows a line graph in which the x-axis stands for the number of attempts at taking the Multistate Bar Exam (MBE) and the y-axis represents the percentage of examinees. The reader get the general impression that there is a big drop in the number of repeaters after the first attempt. The descent flattens out and starts to approach zero at the fifth and later attempts. This general impression seems to support the Proposed Section 316 to shorten the look-back period to 2 years (5 attempts), since the number of examinees seems infinitesimal after five attempts.
Figure 1. Percentage of Examinees Taking the MBE One or More Times(N=30,878; 1st attempt in July 2006)
Percent taking
Number of Times Taking the MBE
But upon closer examination, it’s hard to make sense of what this figure is depicting.
It is said that a picture paints a thousand words, but this graph –like other graphs the Standards Committee used in its report–raises a thousand questions.
- Figure 1 refers to 30,878. It is difficult, if not impossible, for the reader to tell what the 30,878 stands for.
- Does 30,878 represent the number of people who took exam the first time in July 2006 and those who re-took the exam again during the July 2006-July 2011 period?
- Where does the number 30,878 come from? Is it the total number of examinees from ABA law schools or does it include examinees from non-ABA law schools?
- Are the 30,878 a sample of a larger population of examinees? If so, what is the size of this population?
- How was the sample chosen? What was the procedure for choosing the sample?
- Is this sample an accurate depiction of the population of examinees? What confidence can we have that that the conclusions about this sample apply to a larger group of people?
- Figure 1 refers to percentages. For example, in the first try, there’s 84%; 2nd try, 10%, etc.
- What numbers do these percentages refer to? 30,878? Different numbers of examinees who took the bar from July 2006 to July 2011? If so what are those numbers?
- There are also obvious questions that the Standards Committee did not ask:
- Are the repeaters from a wide range of schools? Do the repeaters disproportionately come from schools with large populations of graduates of color?
- What explains the low percentage of repeaters? Does the need to earn an income and opportunity cost of preparing for the exam suppress re-taking the bar?
- What is the behavior of the re-takers? Do they skip a year or take it for the next bar exam administered?
If the Standards Committee answered these questions, we would at least get a basic understanding of the repeater. It certainly isn’t too much to ask for this.
Are there plausible explanations for the Standard Committee’s numbers?
Yes, but, they aren’t in the Standards Committee April 26-27, 2013 minutes.
Could the 30,878 refer to the actual number of examinees who took the bar exam in July 2006?
No. An analysis of the National Conference of Bar Examiners’ own data shows that the 30,878 has to be a sample, not the actual population of examinees who took the July 2006 exam.
According to the NCBE statistics, there were 47,793 first-time takers of the July 2006 bar exam compared to 30,878 examinees in Figure 1. Could the 30,878 be those who were from only ABA law schools? The NCBE did not publish a breakdown of the examinee’s law schools so it’s hard to compute an exact number examinees from ABA schools. However a pretty good estimate can be derived. For both the February and July 2006 bar exams, there were 9,056 examinees from non-ABA law schools, law schools outside the U.S., and from law office study. If you assumed that all of these 9,056 non-ABA examinees took the July 2006 bar exam and subtracted this number from 47,793, you would get a low-end estimate of how many July 2006 bar examinees were from ABA law schools—and that estimate is 38,737. Still even with that generous estimate, there is a 7,859 discrepancy (38,737-30,878) greater than a 25% difference between the two numbers. If the 30,878 includes students from non-ABA and ABA law schools, the discrepancy is even bigger.
The Takeaway
For a proposal as important as this, the Committee should have done a better job of providing detail on the data from their study and the methodology behind the study. That’s needed for anyone to be able to make an informed opinion about whether the shortening of the look-back period is a good or bad policy. They should have shown the analysis that would give confidence that the sample is not systematically biased and is reflective of the actual population of examinees.
Moreover, the study should have gone further and provided detail on the sample of examinees depicted in the study. Greater detail is needed on the make-up of the repeaters. If the repeaters came from a wide variety of law schools, that would bolster the Committee’s argument of no-harm; however if the repeaters come from law schools with above-average percentages of students of color, then a shortening of the look-back period would seem to undermine these school’s ability to meet the proposed higher ultimate bar pass rate.
No one is saying that the numbers are wrong or cooked—but there simply isn’t enough information to give us confidence about the conclusions. There are certainly possible plausible explanations to give sense to the numbers, and it’s very possible that further detail and explanation would allay the concerns laid out in this posting. With a proposed big change like Section 316, it’s important to see what those explanations and details are.

